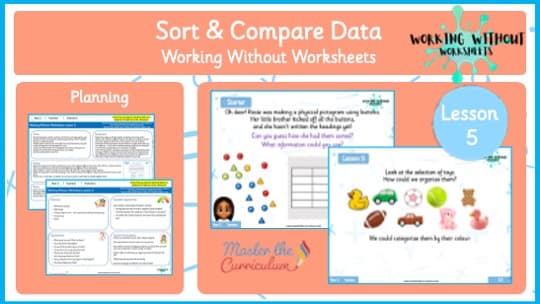
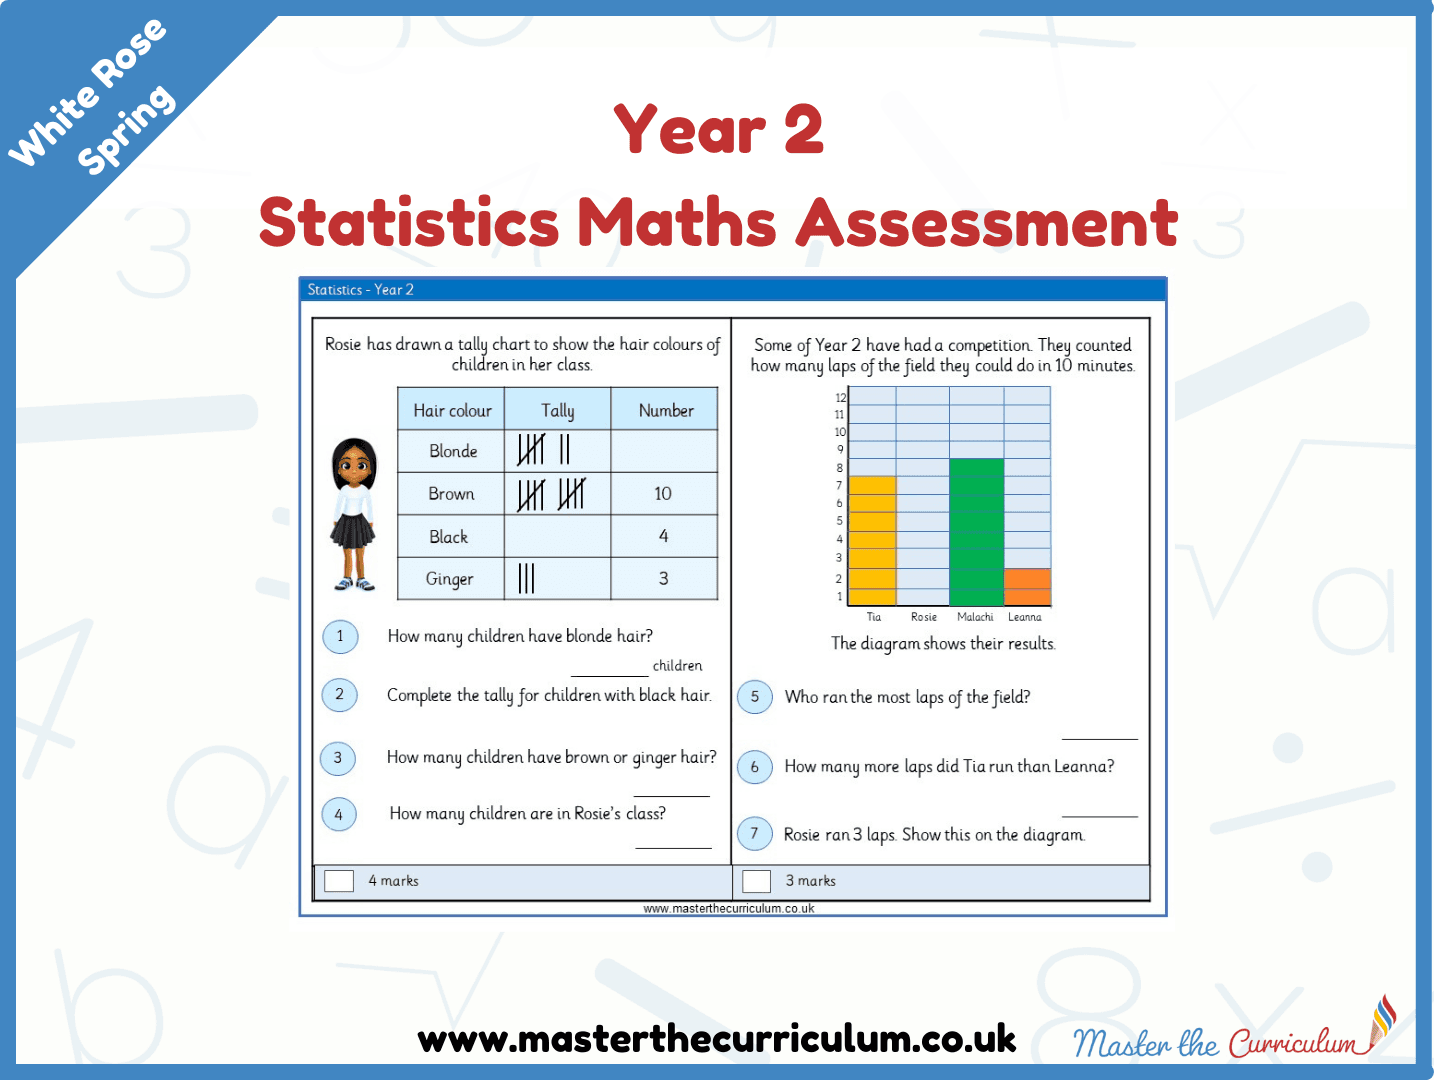
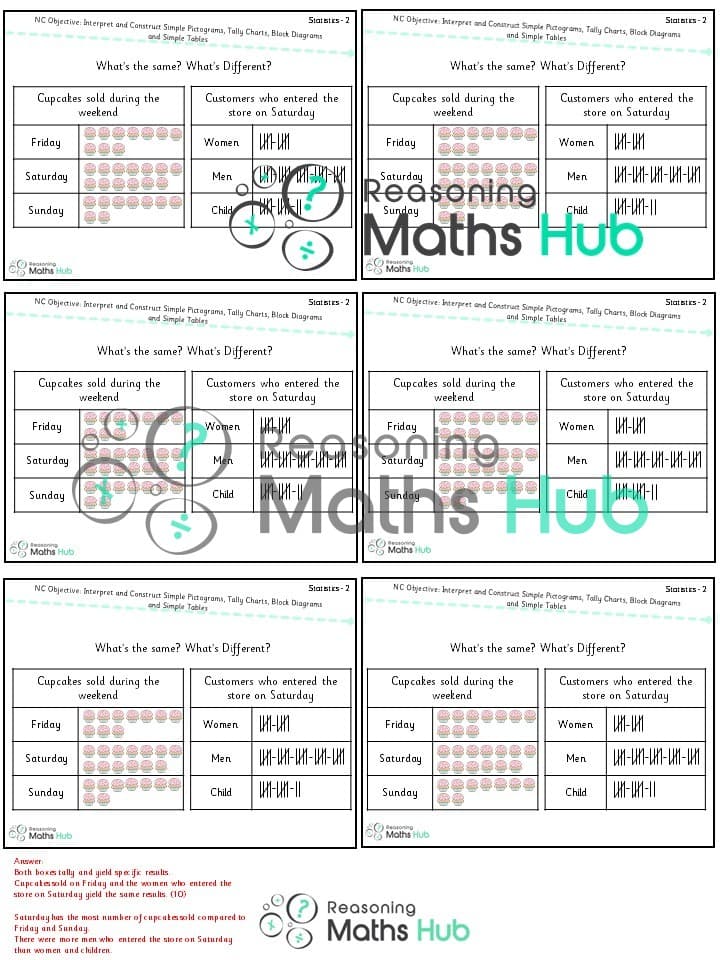
In this final Year 2 Statistics lesson , children bring together everything they’ve learned about pictograms, tally charts, and block diagrams to sort, categorise, total, and compare data in a fully hands-on way. Designed for Working Without Worksheets , this practical and collaborative lesson develops key skills in reasoning, organisation, and interpretation — helping pupils understand how data can be represented and analysed in different ways. The lesson begins with a problem-solving starter , where pupils help Rosie figure out her empty pictogram. By using the number of categories and the clues on the slide, children deduce how the data might have been sorted — learning to think critically about how information is grouped and what those groups represent. Through animation and class discussion, they discover that Rosie's data was sorted by colour, not shape, because of the number of categories shown. In the main teaching input , pupils revisit all the statistical tools they have learned — pictograms, tally charts, tables, and block diagrams — and explore how sorting choices affect the totals and the questions we can ask. Using visual examples such as buttons and toys, children experiment with sorting data by different attributes — colour, shape, type, or size — and discuss how the totals change depending on how the items are grouped. The teacher models how to ask and answer comparative questions such as: Which group has more or fewer? How many more ___ than ___? How could we sort this a different way? During the activity , pupils work collaboratively in small groups to sort real items (e.g., classroom objects, toy food, or coloured counters) in a variety of ways. Each group decides how to categorise the objects and records their results in their maths books, showing their different sorting strategies and the totals for each group. This could include diagrams, simple pictograms, or drawn tables depending on ability. The activity can be run as a ‘round robin’ , withRead more
In this final Year 2 Statistics lesson , children bring together everything they’ve learned about pictograms, tally charts, and block diagrams to sort, categorise, total, and compare data in a fully hands-on way. Designed for Working Without Worksheets , this practical and collaborative lesson develops key skills in reasoning, organisation, and interpretation — helping pupils understand how data can be represented and analysed in different ways. The lesson begins with a problem-solving starter , where pupils help Rosie figure out her empty pictogram. By using the number of categories and the clues on the slide, children deduce how the data might have been sorted — learning to think critically about how information is grouped and what those groups represent. Through animation and class discussion, they discover that Rosie's data was sorted by colour, not shape, because of the number of categories shown. In the main teaching input , pupils revisit all the statistical tools they have learned — pictograms, tally charts, tables, and block diagrams — and explore how sorting choices affect the totals and the questions we can ask. Using visual examples such as buttons and toys, children experiment with sorting data by different attributes — colour, shape, type, or size — and discuss how the totals change depending on how the items are grouped. The teacher models how to ask and answer comparative questions such as: Which group has more or fewer? How many more ___ than ___? How could we sort this a different way? During the activity , pupils work collaboratively in small groups to sort real items (e.g., classroom objects, toy food, or coloured counters) in a variety of ways. Each group decides how to categorise the objects and records their results in their maths books, showing their different sorting strategies and the totals for each group. This could include diagrams, simple pictograms, or drawn tables depending on ability. The activity can be run as a ‘round robin’ , with
Show less