
Statistics
Y5Year 5 Statistics Home Learning

masterthecurriculum.co.uk
4.453 reviews
Included with membershipProposed versionTrusted by primary teachers across the UK · New resources every week
Statistics
Y5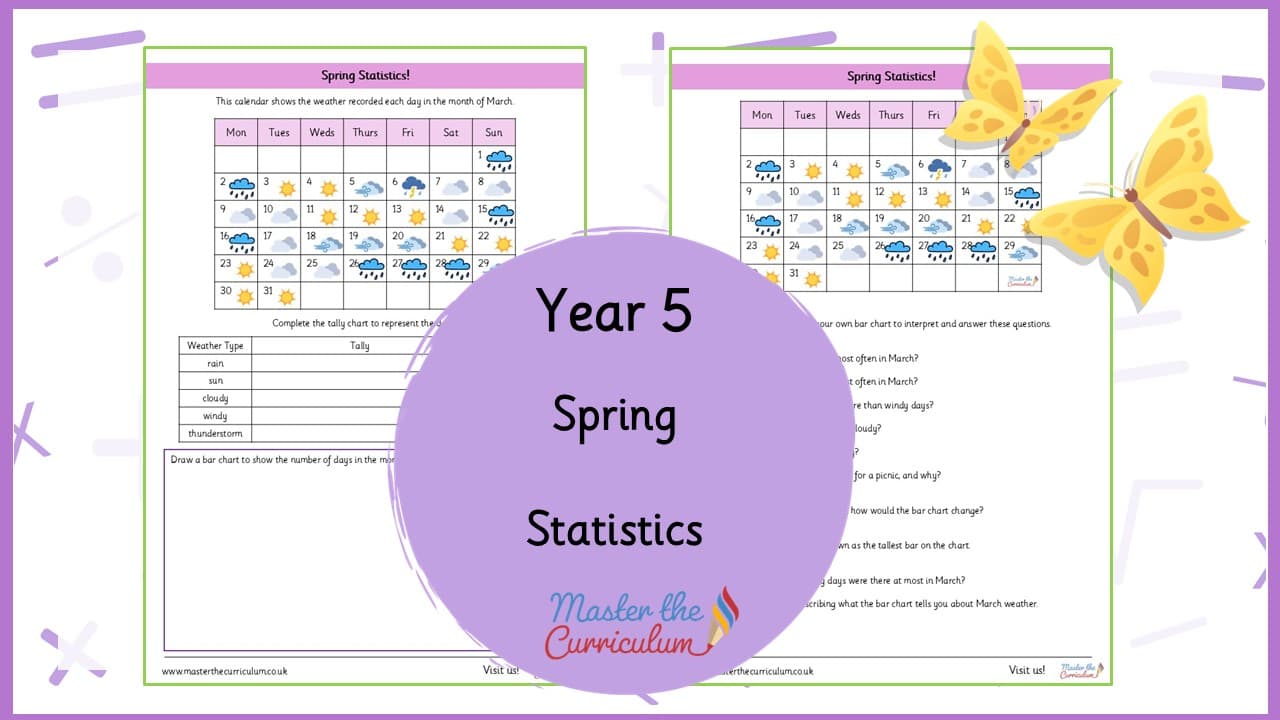
Preview only. The download is a fully editable file.
1 page shown before you download
1CoverThe rest of the pack
Planning, teaching slides and all three worksheet levels come with the download.
Spring-themed Year 5 statistics activity: record March weather, create tally and bar charts, and interpret data. Includes reasoning questions and differentiation options.
Included with membership
Unlock with membershipAlready a member? Sign in and it downloads from this page.
Keep it for later and group it with the rest of the block. No account needed to start.
Bring spring into the classroom while developing essential data-handling skills with this engaging Year 5 statistics activity. Pupils collect, organise, represent, and interpret weather data for the month of March, allowing them to practise key statistics skills over a longer time period than a single week. Children begin by recording daily weather in a tally chart, grouping marks in fives and ensuring accurate totals. They then convert this data into a bar chart, selecting an appropriate scale, labelling axes clearly, and drawing proportional, evenly spaced bars. Once the charts are complete, pupils answer reasoning and interpretation questions, identifying trends, calculating fractions, comparing totals, and justifying conclusions with data. Aligned with Year 5 National Curriculum objectives, this activity supports reading, interpreting, and presenting data, as well as problem-solving using sums, differences, and comparisons. It is ideal for independent work, group tasks, or maths stations, and can be differentiated by providing partial charts or extending challenges for higher-attaining pupils. With its spring-themed context, this resource makes statistics practical, meaningful, and engaging.
Show lessThe standard small step pack, as her own modules ship it. We do not print page counts here, because her catalogue does not publish them and a guessed number is worse than none.
Her own system, with the star count repeated in every worksheet header so a child can be handed the right sheet without a word.
Statistics
Y5Statistics
Y5
Statistics
Y5
Statistics
Y5
Statistics
Y5
One email a week, for the year group you actually teach. Unsubscribe in a click.