
Key Events & Seasonal
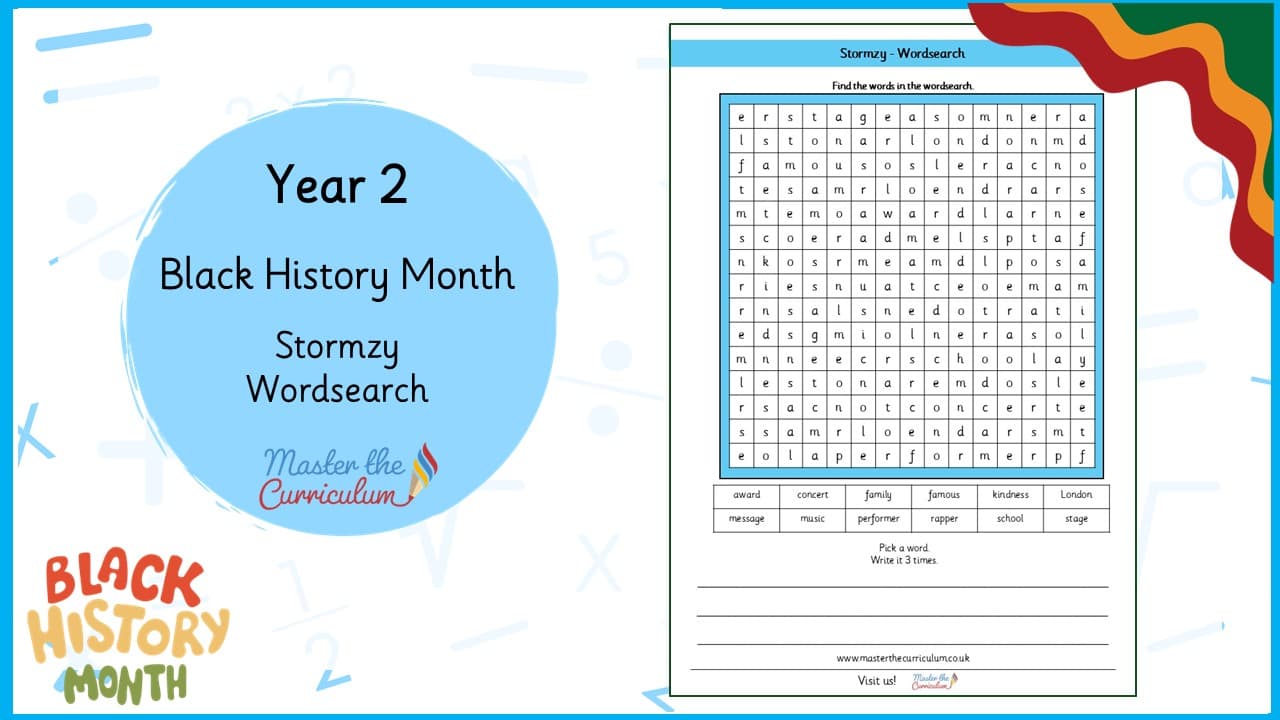
Y2Stormzy – Wordsearch
masterthecurriculum.co.uk
Proposed versionTrusted by primary teachers across the UK · New resources every week
Key Events & Seasonal
Y2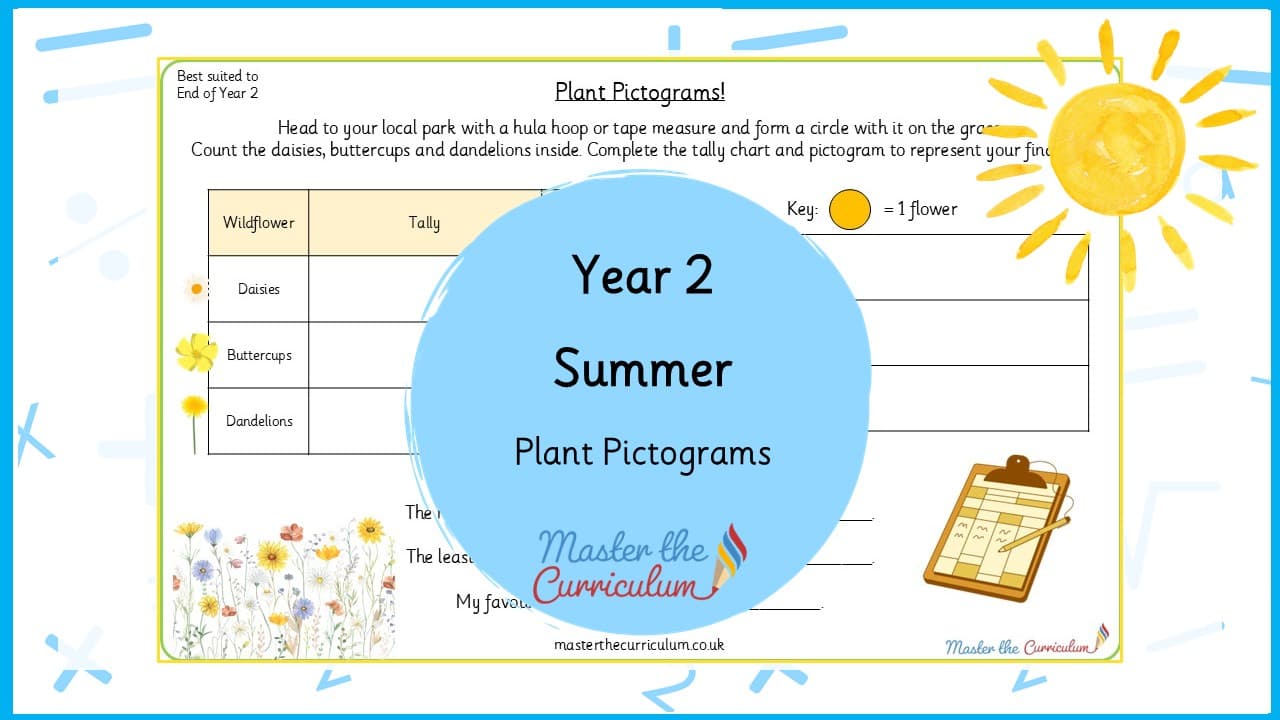
Preview only. The download is a fully editable file.
1 page shown before you download
1CoverThe rest of the pack
Planning, teaching slides and all three worksheet levels come with the download.
A fun, hands-on Year 2 activity where students count flowers in a park or school field, record data in a tally chart, and create a pictogram. Perfect for teaching statistics through outdoor learning.
Included with membership
Unlock with membershipAlready a member? Sign in and it downloads from this page.
Keep it for later and group it with the rest of the block. No account needed to start.
Engage your Year 2 students with this interactive Plant Pictograms activity , designed to bring statistics to life! Perfect for children towards the end of Year 2, this hands-on resource helps students practice data collection, tally charts, and pictograms while exploring nature. Students can visit a local park or the school field, use a hula hoop or tape measure to create a circle on the grass, and count daisies, buttercups, and dandelions within the area. They then record their findings in a tally chart and represent the data visually using a pictogram. This activity encourages outdoor learning, promotes observation skills, and supports the development of key statistics objectives in a fun, engaging way. Ideal for teachers looking to combine math, science, and outdoor education .
Show lessThe standard small step pack, as her own modules ship it. We do not print page counts here, because her catalogue does not publish them and a guessed number is worse than none.
Her own system, with the star count repeated in every worksheet header so a child can be handed the right sheet without a word.
Key Events & Seasonal
Y2Key Events & Seasonal
Y2
Key Events & Seasonal
Y2
Key Events & Seasonal
Y2
Key Events & Seasonal
Y2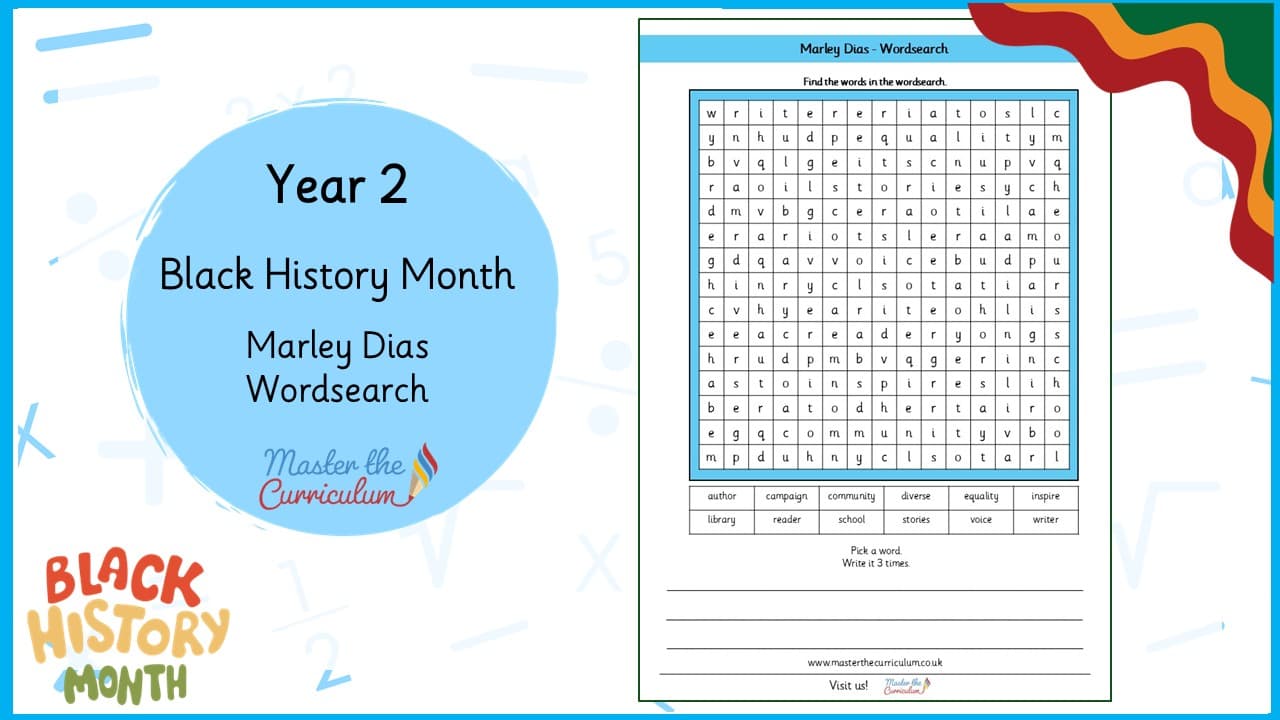
One email a week, for the year group you actually teach. Unsubscribe in a click.