Skip to content

Proposed version

Master the Curriculum

Statistics

Y5

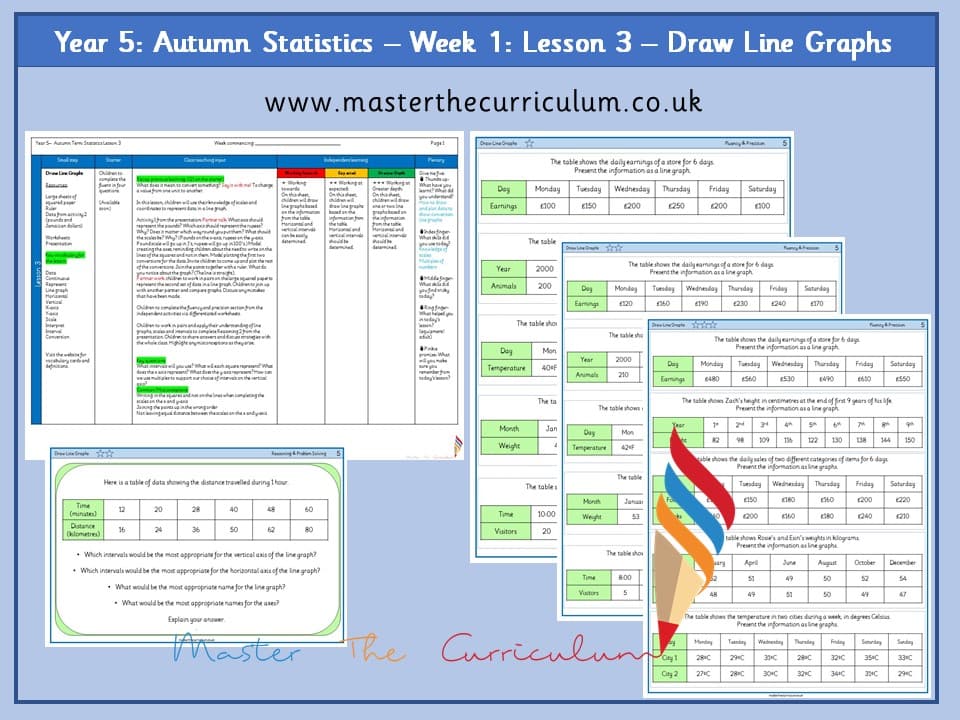
Year 5: Statistics: Lesson 3 – Draw Line Graphs

masterthecurriculum.co.uk3 levels

Preview only. The download is a fully editable file.

See inside

1 page shown before you download

Cover of Year 5: Statistics: Lesson 3 – Draw Line Graphs1Cover
Cover and first page

The rest of the pack

Planning, teaching slides and all three worksheet levels come with the download.

Year 5Statistics

Year 5: Statistics: Lesson 3 – Draw Line Graphs

Included with membership

Unlock with membership

Already a member? Sign in and it downloads from this page.

Keep it for later and group it with the rest of the block. No account needed to start.

  • Fully editable Word or PowerPoint file
  • Differentiated three ways
  • Instant download, no watermark

About this resource

Year 5: Statistics: Lesson 3 - Draw Line Graphs Planning Differentiated Worksheets Differentiated Reasoning TasksRead more

Year 5: Statistics: Lesson 3 - Draw Line Graphs Planning Differentiated Worksheets Differentiated Reasoning Tasks

Show less

What you get, 6 files

  • PDFPlanning
  • PPTXPlanning, editable
  • PDFTeaching slides
  • PPTXTeaching slides, editable
  • PDFWorksheets, all three levels
  • PPTXWorksheets, editable

The standard small step pack, as her own modules ship it. We do not print page counts here, because her catalogue does not publish them and a guessed number is worse than none.

★★★ Differentiated three ways
  • Working towardsScaffolded, with the model or the bar already drawn.
  • Working withinThe expected standard for the year group.
  • Greater depthReasoning and explaining, not just more of the same.

Her own system, with the star count repeated in every worksheet header so a child can be handed the right sheet without a word.

The rest of this block

Statistics, Year 510 numbered lessons

  1. Lesson 1Year 5: Statistics: Lesson 1 – Read and Interpret Line Graphs
  2. Lesson 2Year 5: Statistics: Lesson 2 – Draw Line Graphs
  3. Lesson 3 · you are hereYear 5: Statistics: Lesson 3 – Draw Line Graphs
  4. Lesson 4Year 5: Statistics: Lesson 4 – Problems with Line Graphs
  5. Lesson 5Year 5: Statistics: Lesson 5 – Problems with Line Graphs

More statistics for Year 5

Statistics

Y5

Year 5 Statistics Home Learning

masterthecurriculum.co.uk
4.453 reviews
Included with membership

Statistics

Y5

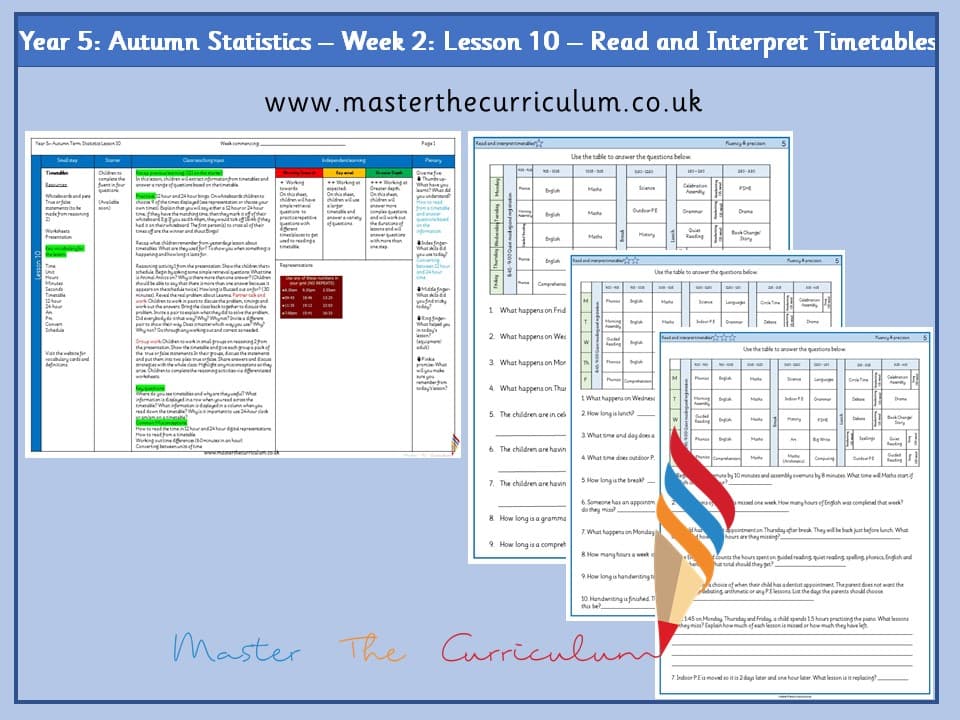
Year 5: Statistics: Lesson 10 – Read and Interpret Timetables

masterthecurriculum.co.uk3 levels
4.914 reviews
Included with membership

Statistics

Y5

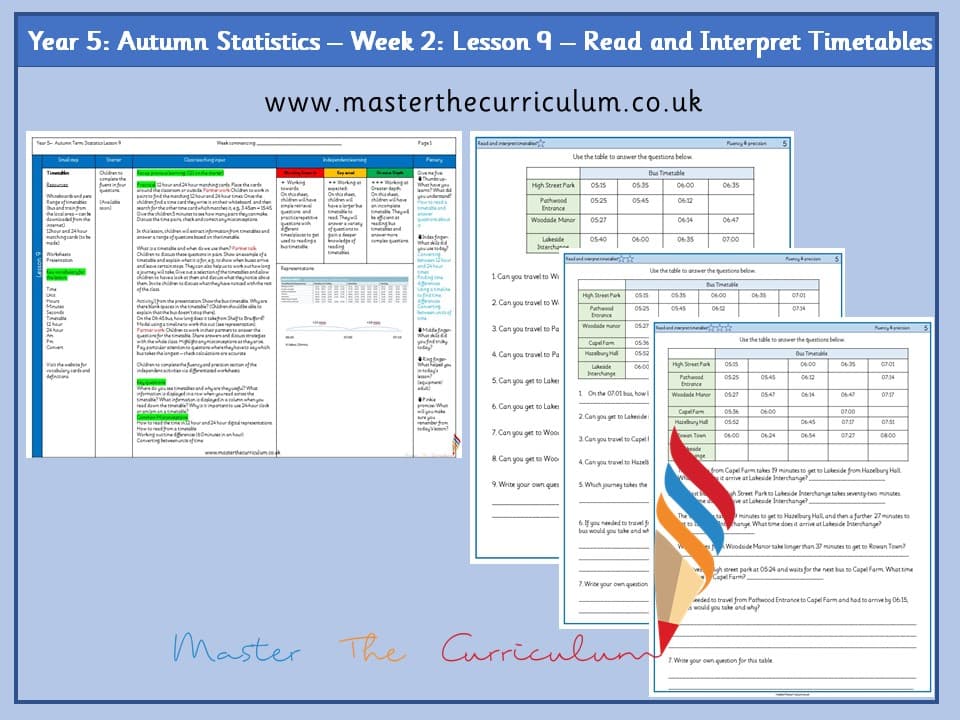
Year 5: Statistics: Lesson 9 – Read and Interpret Timetables

masterthecurriculum.co.uk3 levels
Included with membership
Editable worksheetsWord and PowerPoint, so you can change anythingWhite Rose supportingFollows the small steps you already plan fromDownloadable lesson plansPlanning, slides and worksheets for every stepReasoning and problem solvingBuilt into every step, not sold separately

A free resource every Friday

One email a week, for the year group you actually teach. Unsubscribe in a click.

Year group you teach