Skip to content

Proposed version

Master the Curriculum

Working Without Worksheets

Y2

L1 Pictograms

masterthecurriculum.co.uk

Preview only. The download is a fully editable file.

See inside

1 page shown before you download

Cover of L1 Pictograms1Cover
Cover and first page

The rest of the pack

Planning, teaching slides and all three worksheet levels come with the download.

Year 2Working Without Worksheets

L1 Pictograms

4.650 reviews

An engaging Working Without Worksheets Year 2 Statistics lesson introducing pictograms through hands-on group work and real-life data representation. Includes full plan, slides, and a creative “data detectives” activity.

Included with membership

Unlock with membership

Already a member? Sign in and it downloads from this page.

Keep it for later and group it with the rest of the block. No account needed to start.

  • Fully editable Word or PowerPoint file
  • Differentiated three ways
  • Instant download, no watermark

About this resource

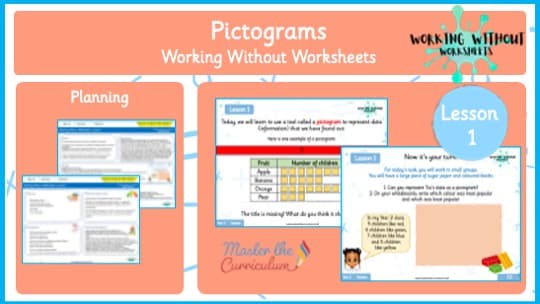
This Working Without Worksheets Year 2 Statistics lesson introduces pupils to the world of data handling through a hands-on, detective-style exploration of pictograms. Designed to make early statistics fun and meaningful, this lesson helps children understand how to collect, represent, and interpret information visually using symbols and pictures. The starter recaps prior learning from position and direction, shape, and money units, before introducing the concept of statistics . Children discuss what the word means and explore how statisticians (or “data detectives”) gather information, look for patterns, and draw conclusions. Using engaging examples, pupils brainstorm questions they could investigate — such as favourite foods, colours, or pets — linking data collection to their own lives. During the introduction , pupils learn that a pictogram is a visual way to show information. The class examines an example pictogram with its title hidden, using observation and reasoning skills to infer what it might represent before revealing the topic (favourite fruits). The teacher then breaks down each part of the pictogram, emphasising that each picture or symbol represents one item or vote and that relevant images (like apples for fruit or coloured blocks for colours) help make data easier to interpret. Together, the class builds a pictogram step by step using animated slides and a shared dataset about pets , discussing what the pictogram shows, and identifying which categories are the most and least popular. The activity takes the learning off the page and into the classroom environment. Working in small groups, children use coloured cubes or counters and large sugar paper to construct their own pictograms to represent Tia’s data . They must choose an appropriate title, organise their pictogram neatly, and use one block to represent one vote. On a whiteboard, each group records sentences explaining which colour is most and least popular. This active, practical, and collaboRead more

This Working Without Worksheets Year 2 Statistics lesson introduces pupils to the world of data handling through a hands-on, detective-style exploration of pictograms. Designed to make early statistics fun and meaningful, this lesson helps children understand how to collect, represent, and interpret information visually using symbols and pictures. The starter recaps prior learning from position and direction, shape, and money units, before introducing the concept of statistics . Children discuss what the word means and explore how statisticians (or “data detectives”) gather information, look for patterns, and draw conclusions. Using engaging examples, pupils brainstorm questions they could investigate — such as favourite foods, colours, or pets — linking data collection to their own lives. During the introduction , pupils learn that a pictogram is a visual way to show information. The class examines an example pictogram with its title hidden, using observation and reasoning skills to infer what it might represent before revealing the topic (favourite fruits). The teacher then breaks down each part of the pictogram, emphasising that each picture or symbol represents one item or vote and that relevant images (like apples for fruit or coloured blocks for colours) help make data easier to interpret. Together, the class builds a pictogram step by step using animated slides and a shared dataset about pets , discussing what the pictogram shows, and identifying which categories are the most and least popular. The activity takes the learning off the page and into the classroom environment. Working in small groups, children use coloured cubes or counters and large sugar paper to construct their own pictograms to represent Tia’s data . They must choose an appropriate title, organise their pictogram neatly, and use one block to represent one vote. On a whiteboard, each group records sentences explaining which colour is most and least popular. This active, practical, and collabo

Show less

What you get, 6 files

  • PDFPlanning
  • PPTXPlanning, editable
  • PDFTeaching slides
  • PPTXTeaching slides, editable
  • PDFWorksheets, all three levels
  • PPTXWorksheets, editable

The standard small step pack, as her own modules ship it. We do not print page counts here, because her catalogue does not publish them and a guessed number is worse than none.

★★★ Differentiated three ways
  • Working towardsScaffolded, with the model or the bar already drawn.
  • Working withinThe expected standard for the year group.
  • Greater depthReasoning and explaining, not just more of the same.

Her own system, with the star count repeated in every worksheet header so a child can be handed the right sheet without a word.

The rest of this block

Working Without Worksheets, Year 211 numbered lessons

  1. Lesson 1 · you are herePictograms
  2. Lesson 2– WWW – Y2 Counting in Steps of 5
  3. Lesson 3– WWW – Y2 Counting in Steps of 3
  4. Lesson 4– WWW – Y2 Counting in tens from any number forwards and backwards
  5. Lesson 5– WWW – Y2 Recall Facts to 20

What teachers said after they used it

All reviews →
4.650 verified reviewsWe ask once, seven days after the download, and one tap is enough.
Joanne PicklesYear 3 teacher, Crossflatts Primary, BingleyVerified download, 5 March 2026

Printed it at eight on a Sunday and taught it on the Monday.

No editing, no reformatting, no hunting for the answers. The three levels are on separate pages, which sounds obvious until you have used the sites where they are not.

10 teachers found this helpful
Michael FerrisMaths lead, Cheadle Heath Primary, StockportVerified download, 16 February 2026

Matches our White Rose planning almost week for week.

I stopped adapting things from three different sites and now start here. The odd week does not line up exactly, but the small step it covers is always somewhere in the same block.

8 teachers found this helpful

Aisha KarimSENCO, Newlands Primary Academy, LutonVerified download, 2 February 2026

The editable file is why we renewed.

Being able to change two questions for the child who joined us in January, without rebuilding the whole sheet, is worth the subscription on its own.

12 teachers found this helpful

More working without worksheets for Year 2

Editable worksheetsWord and PowerPoint, so you can change anythingWhite Rose supportingFollows the small steps you already plan fromDownloadable lesson plansPlanning, slides and worksheets for every stepReasoning and problem solvingBuilt into every step, not sold separately

A free resource every Friday

One email a week, for the year group you actually teach. Unsubscribe in a click.

Year group you teach