
Working Without Worksheets
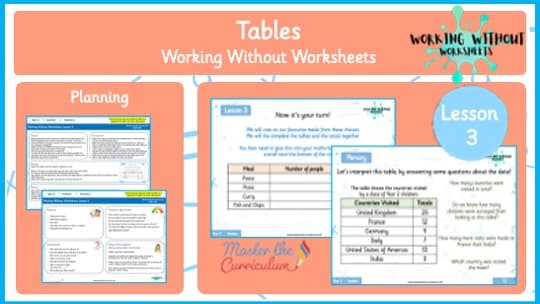
Y2L3 Tables
masterthecurriculum.co.uk
Proposed versionTrusted by primary teachers across the UK · New resources every week
Working Without Worksheets
Y2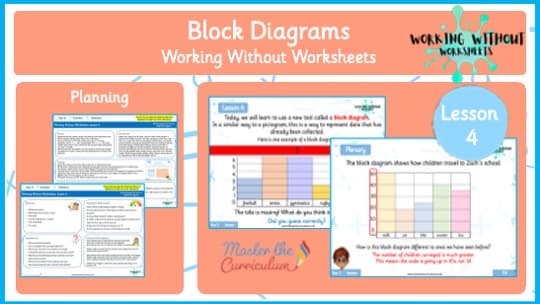
Preview only. The download is a fully editable file.
1 page shown before you download
1CoverThe rest of the pack
Planning, teaching slides and all three worksheet levels come with the download.
A practical and engaging Year 2 Statistics lesson introducing block diagrams. Children build and interpret their own diagrams using cubes and real data — no worksheets required!
Included with membership
Unlock with membershipAlready a member? Sign in and it downloads from this page.
Keep it for later and group it with the rest of the block. No account needed to start.
In this interactive Year 2 Statistics lesson , children explore how to represent data using block diagrams , developing their understanding of visual data interpretation and comparison. This Working Without Worksheets lesson builds on previous learning about tally charts and pictograms, giving children the chance to see how data can be represented more accurately and on a scale. The lesson begins with a problem-solving starter where pupils interpret Esin’s descriptive data, such as “_____ was 4 seconds faster than _____.” Children must deduce the missing numbers and organise them into a table, reinforcing their ability to extract information from text and organise it systematically — a key skill in statistics and reasoning. In the main teaching input , pupils are introduced to block diagrams and how they compare to pictograms and tally charts. Through animated teaching slides, the teacher models how block diagrams are made up of equal-sized blocks to represent quantities accurately. Pupils investigate what each part of a block diagram shows, what conclusions can be drawn, and how it can be used to answer questions about the data. Using a favourite ice-cream flavours example, the class works together to identify patterns and practise reading scales. During the activity , children work collaboratively in small groups to create their own block diagrams using previously collected data. On large sugar paper, they draw the structure of a block diagram, use multilink cubes or coloured building bricks to represent each category, and label their axes and title. For instance, 8 red cubes could represent 8 votes for pasta. This tactile, visual experience helps pupils deepen their understanding of how data is displayed and compared. Teachers can photograph the group outcomes and add them to pupils’ books as evidence of understanding. The lesson concludes with a reflective plenary using key questions to deepen understanding: What do these blocks represent? How is this different
Show lessThe standard small step pack, as her own modules ship it. We do not print page counts here, because her catalogue does not publish them and a guessed number is worse than none.
Her own system, with the star count repeated in every worksheet header so a child can be handed the right sheet without a word.
Working Without Worksheets, Year 211 numbered lessons
Working Without Worksheets
Y2Working Without Worksheets
Y2
Working Without Worksheets
Y2
Working Without Worksheets
Y2
Working Without Worksheets
Y2
One email a week, for the year group you actually teach. Unsubscribe in a click.